



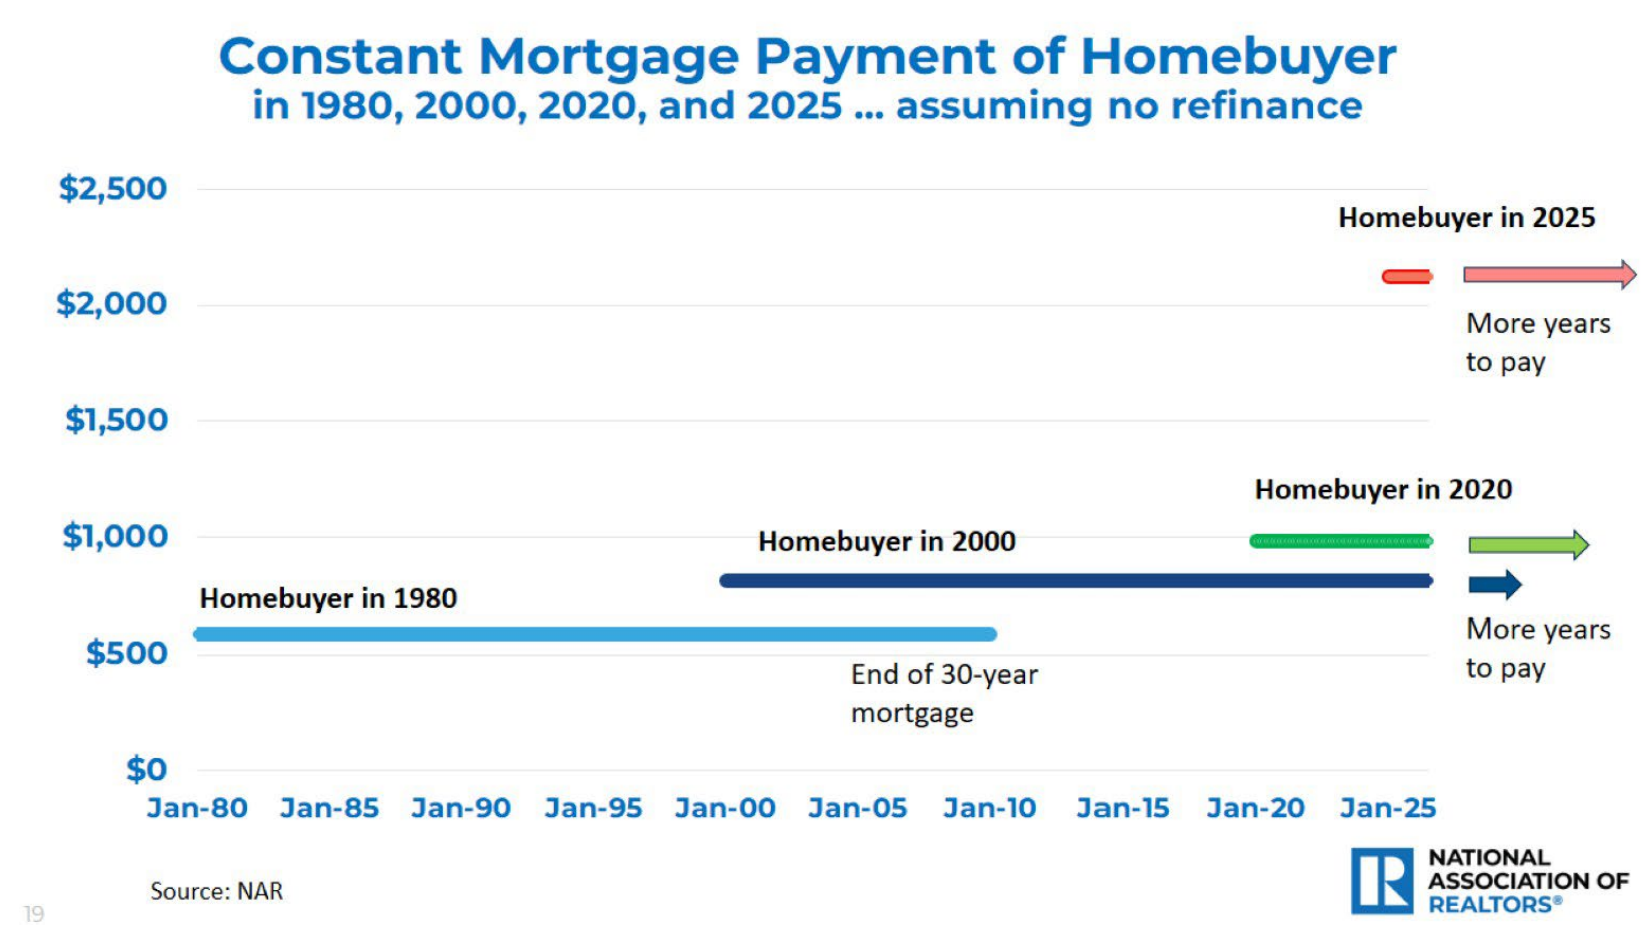
The National Association of Realtors recently shared a chart that shows how the monthly mortgage payment of a homebuyer has changed across generations. It follows buyers in 1980, 2000, 2020, and 2025, assuming none of them refinance.
If you’re a first-time buyer today and the numbers feel harder than what your parents or grandparents faced, the chart suggests you’re right.
What the chart shows
These are my rough readings of the graphic, so treat them as ballpark figures:
- Buyer in 1980: about $600 a month, with the loan paid off around 2010
- Buyer in 2000: about $800 a month, with the loan running to 2030
- Buyer in 2020: about $1,000 a month, with the loan running to 2050
- Buyer in 2025: about $2,100 a month, with the loan running to 2055
The jump is the story. The 2025 buyer’s payment is roughly double the 2020 buyer’s and more than three times what the 1980 buyer started with. The chart’s “More years to pay” arrows add a second point: a buyer today carries that higher payment further into the future.
A fair caveat
This chart shows payments in the dollars of each era, not adjusted for inflation, and incomes were lower in 1980 too. So the raw gap looks bigger than the real-world gap. But even with that in mind, the direction is clear. Over recent years, home prices and mortgage rates have both climbed, and the monthly cost of entry has climbed with them.
Why this is a tougher road than the last generation’s
Higher prices and higher rates at the same time. A mortgage payment is driven by both the price of the home and the interest rate. When both rise together, the monthly payment jumps, which is what the 2020-to-2025 leap on this chart reflects.
A bigger piece of the budget. The payment on the chart covers only principal and interest. Property taxes, homeowners insurance, and maintenance come on top, and those costs have been rising too.
Saving while paying high rent. Many of today’s first-time buyers are trying to build a down payment while already paying elevated rents, which makes it harder to save.
More years of debt. The later you take on a loan, the later it ends. A 2025 buyer on a 30-year mortgage is paying until 2055.
What this means if you’re thinking about buying
I’m not going to tell you this is easy, because the numbers say otherwise, and this chart is a national picture. Seattle prices run well above the national average, so many local buyers face an even larger payment. Here’s how I’d approach it:
- Know your real number. Look at the full monthly cost, including taxes, insurance, and upkeep, not just the loan payment.
- Don’t measure yourself against the past. Your parents’ payment isn’t a useful benchmark. What matters is what fits your income and your life today.
- Be honest about timing. Whether to buy now, wait, or keep renting depends on your finances, your plans, and how long you expect to stay in one place. There’s no single right answer, and waiting can be a perfectly reasonable choice.
- Don’t plan around a refinance. The chart assumes none. Rates might fall, but they might not, so build a budget that works at the rate you can get today.
The bottom line
Buyers today are paying more to get started than any generation before them. That’s not a failure of planning or discipline. It reflects a real shift in what housing costs. Understanding that shift, and running your own numbers honestly, is the best place to start.
Check out this article next